Spam Master Uptime Monitor is a great solution to monitor your website or server for down time, unavailability and response times without the need of any client software installation. Get immediate notifications if your website, server goes down or if the response header changes status.
- No client, agent installation needed, easy to deploy.
- Monitors website domains, website pages or website ports (80, 443, 8080, etc.) E.g. https://www.example.com, https://www.example.com/login or https://www.example.com:8080
- Monitors server IP’s and service ports (21, 22, 389, etc). E.g. 192.168.01.01 or 192.168.01.01:21
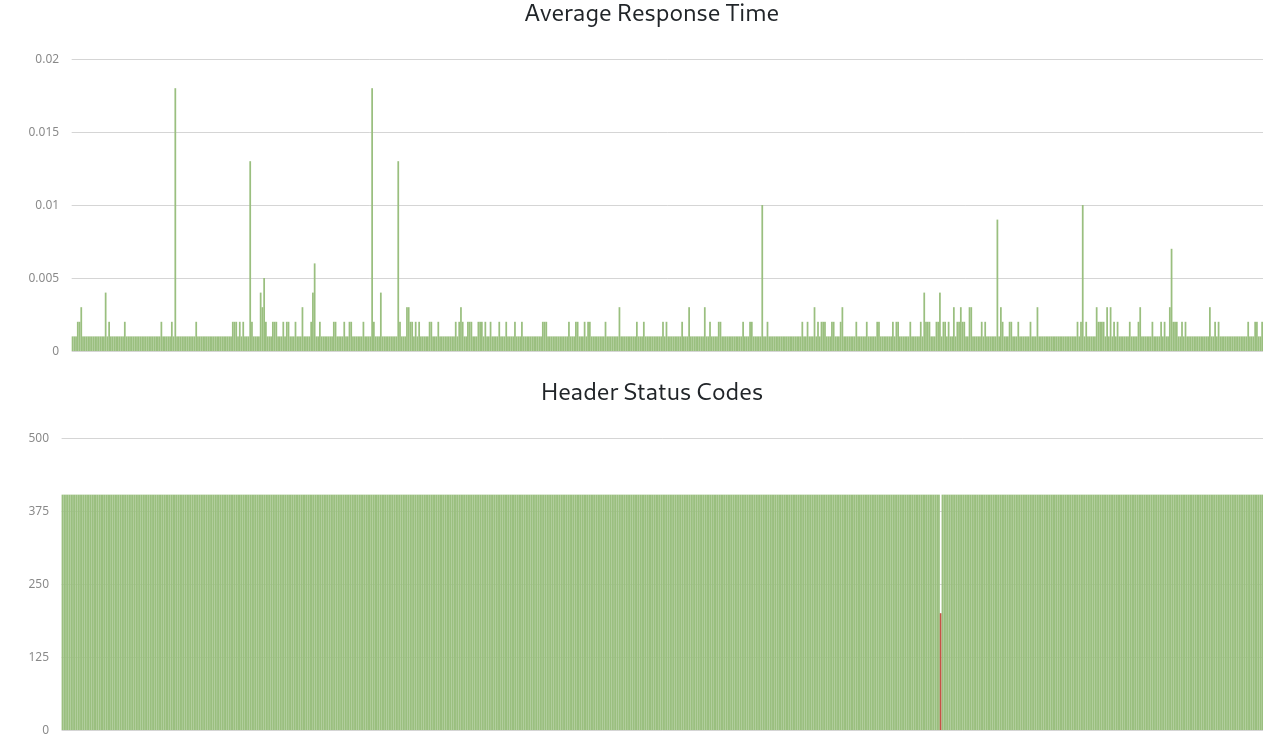
- Monitors, logs and displays charts of response times.
- Monitors response headers for status code changes.
- 24/7 Monitoring for heavier loads and 24/7 notifications.
- Every minute checking.
- Real-time statistics of collected data.
If you haven’t done so start by creating an account or login using the top Login button. Fill your profile and after click the Uptime Monitor menu.

5 0 Bubble with count
- 5 Green indicates how many websites, servers are OK and UP.
- 0 Red indicates how many websites, servers are DEAD or DOWN and require your immediate attention.
Add Uptime Monitor
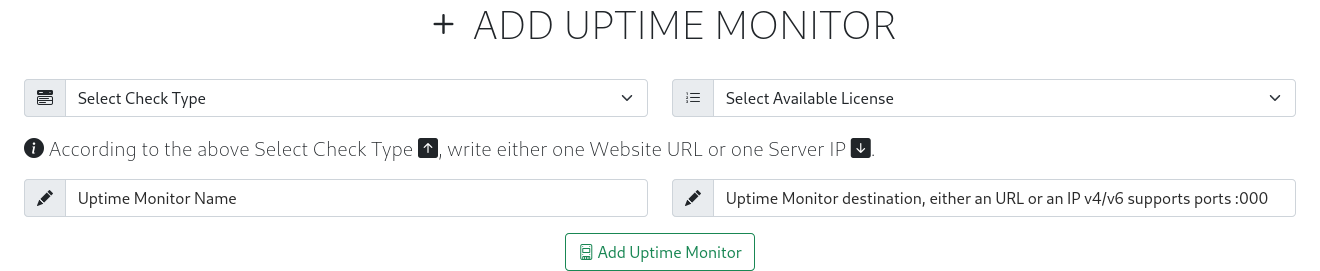
- Select Check Type allows you to choose from monitor a Website domain E.g. https://www.my-website.com or a Server IP E.g. 192.168.125.128.
- Select available license:
- A FREE license is automatically generated and displayed in the drop-down.
- All available PRO licenses are also displayed here.
- In use licenses are not displayed here and require deletion via top menu edit in order to re-appear here and be re-used.
- Uptime Monitor Name, insert a short descriptive name to be used in monitors list, alerts, emails and generic notifications.
- Uptime Monitor Destination is the endpoint url or ip to be monitored and relates to Select Check Type:
- If Website insert the full domain url, full domain url/page or full domain url:port E.g.
- Full domain url: https://www.my-website.com
- Full domain url with specific page to monitor: https://www.my-website.com/login or https://www.my-website.com/shop.php
- Full domain url with specific port to monitor: https://www.my-website.com:8080 or https://www.my-website.com:8080/phpmyadmin
- If Server insert the IP or IP:port E.g.
- IP: 192.168.125.85
- IP: 192.168.125.85:21 or 192.168.125.85:22
- When done click Add Uptime Monitor. If by any change you made a mistake or want to re-used the license in another destination or check type you can click Edit Uptime Monitor and delete the license and it will re-appear here.
Edit Uptime Monitor
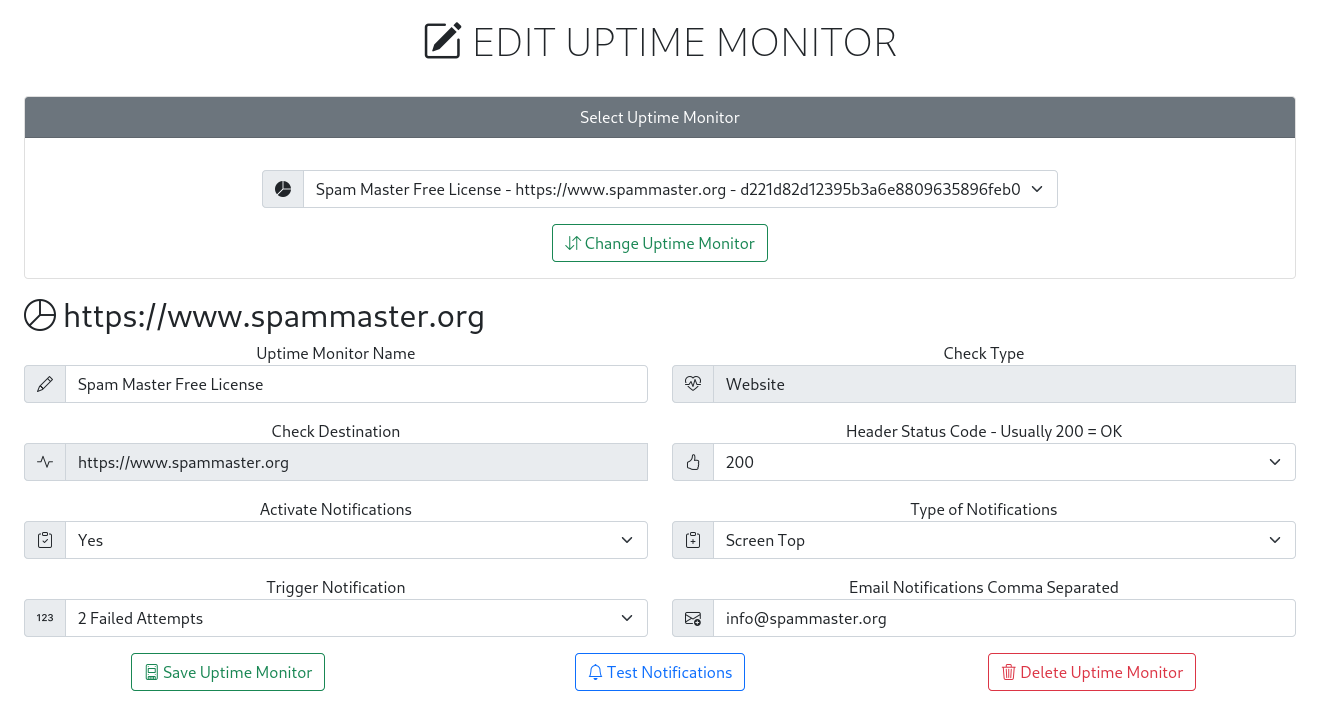
After adding the website or server to be monitored the next step is to edit the notificatios.
- Change Uptime Monitor allows to swap and edit other licenses.
- Uptime Monitor Name allows you to change the website or server onscreen alerts, notifications and emails descriptive name. Best to keep it short.
- Uptime Monitor Check Type should be either website or server. Can not be changed as it invalidates past collected data. Requires monitor deletion and re-add.
- Uptime Monitor Destination should be the website domain, url or server ip. Can not be changed as it invalidates past collected data. Requires monitor deletion and re-add.
- Header status code (usually 200). E.g. if you want to check for instance a non existing page you can change the header status code to 404 or if the page requires authentication or is .htpasswd protected you can change the status code to 401 or 403.
- Activate Notifications needs to be set to Yes in order to receive alerts and notifications. The notifications are triggered whenever the website or server is DOWN and UP or when the header status changes.
- Type of Notifications:
- Screen Top pop-up
- Email recipient.
- Both screen and email.
- Trigger Notification is the number of failed checks required to alert you.
- Email Notifications to one or several email recipients, if more than one recipient insert emails comma separated.
- Footer buttons:
- Saves your editing.
- Tests your alerts and notifications.
- Deletes your monitor. The license can be re-used again via Add Uptime Monitor.
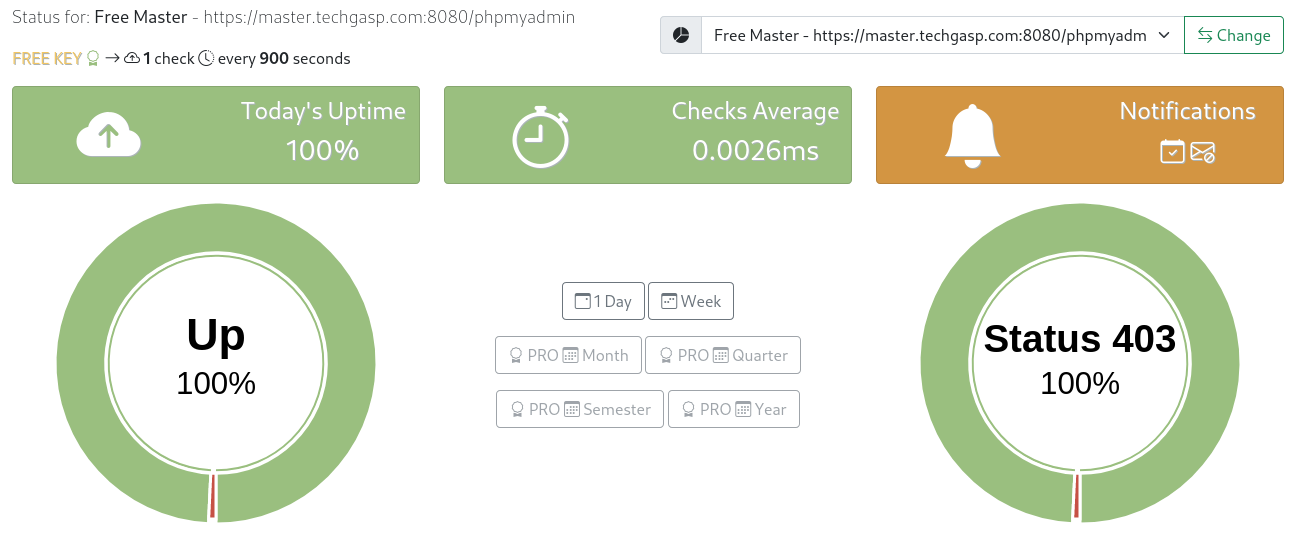
After adding and editing the license you can access the main dashboard clicking the top main menu Uptime Monitor.
The dashboard displays all your Uptime Monitors and the information is self explanatory.
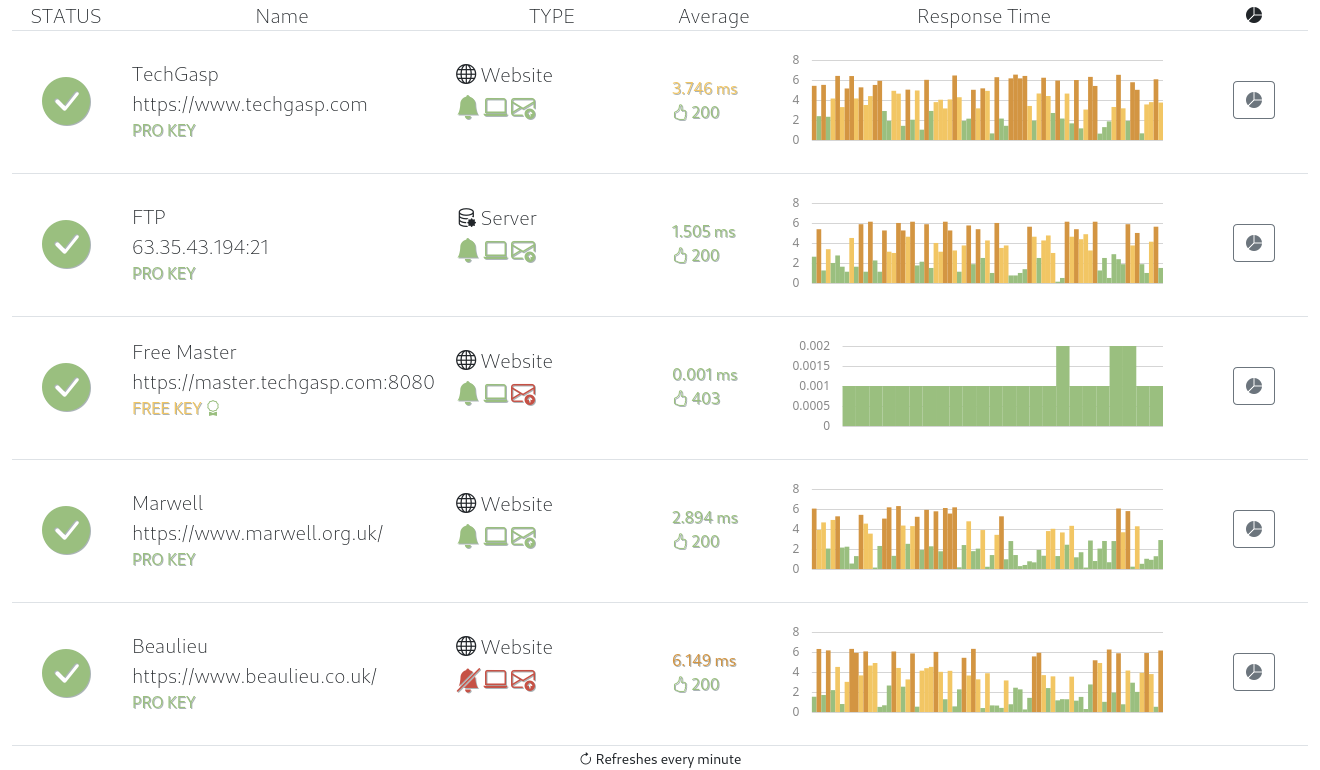
To view detailed data from each website or server monitor with date ranges up to 1 year click detailed data button.